Chance and Data: "Smarties"
Another mathemetical concept I introduced to the children was chance and data, in the following lesson I introduced the children to graphs.
I introduced the lesson by showing the children a box of smarties. I then handed each child a white circle and asked them to go back to their tables, write their name on the circle and colour it in their favourite smartie colour. Back on the foor I asked the children "who likes red smarties?"; all the children who coulured there smarty in red placed there smarties in a pile in the middle of the circle. We did this for every colour until we had numerous piles of coloured
smarties. I asked the children if it was easy to tell which pile had the most
smarties just by looking at them. We agreed that is was hard to tell; here I
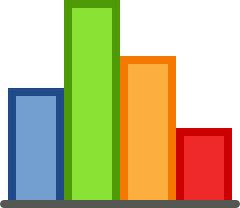
introduced the idea of a graph. We placed the smarties in opposite lines from
the biggest group to the smallest. I then drew this on the board and told the children it was called a graph. We agreed it was much easier to count the number of smarties on the graph. We then talked about the different components of the graph; the axix, lines and numbers. The children decided on a title and headed back to their tables to have a go at drawing the graph in their maths books.
Early finishers then had to draw their own smartie box and write down how many of each coloured smartie will go in their box, useing their graph to help them.
smarties. I asked the children if it was easy to tell which pile had the most
smarties just by looking at them. We agreed that is was hard to tell; here I
introduced the idea of a graph. We placed the smarties in opposite lines from
the biggest group to the smallest. I then drew this on the board and told the children it was called a graph. We agreed it was much easier to count the number of smarties on the graph. We then talked about the different components of the graph; the axix, lines and numbers. The children decided on a title and headed back to their tables to have a go at drawing the graph in their maths books.
Early finishers then had to draw their own smartie box and write down how many of each coloured smartie will go in their box, useing their graph to help them.

At the conclusion of the lesson we came back together on the floor and discussed our findings: "how many more blue smarties then red?" "which one had the least, the most" etc... We then talked about the unopened smartie box, I asked the children if they thought it would be the same as the classrooms graph, why why not? After opening the smartie box I asked the children what conclusions they could make from the lesson. "If I opened another smartie box, would it be the same? What similarities were there between our graph and the smarties in the box? Would this smartie box be suitable for our class based on our classroom graph?" "What else might we use grahs for?". Of course the children wanted to eat the smarties so we ate them during recess :)
This lesson was successful because the children could apply the conceptual knoweldge to a real life scenario. To develop a classroom graph all children had to particpate by creating and selecting there favourite coloured smartie. The children were eager to find out how many other children also liked the same coloured smartie and enjoyed counting them. If I had of given the children a worksheet where they were asked to graph data that was listed on a piece of paper I don't think my lesson would have been as successful. I also believe the children would have become disengaged and bored. The mathematical concept I was trying to teach may have been too abstract for the children to grasp which would have made it extremely challenging to ensure the children reached my intended outcomes.
Click below for detailed lesson plan:
| smarties.docx |
